|
B
arry's
T
ire
Tech This is a series of articles on the technical aspects of tires, their care and usage. My primary purpose in these articles is to help people understand tires and thereby reduce the risks we all face every day. ..........and since tires is just about the only thing I know about.......... Please drop me a note if you have a topic you want to see: Barry@BarrysTireTech.com |
|
Footprint (Contact Patch) Complete Revision, including name. March, 2022. This used to be titled "Air or Tire". There have been several updates - and the latest one is September, 2023. I've indicated what the updates are in the body of the webpage. |
|
What you should get from this page:
|
|
First, it should be obvious that the size of the footprint (contact patch) is somehow related to
the inflation pressure and the load on the tire: Increase the inflation pressure and the footprint gets smaller.
Increase the load and the footprint gets larger.
But the tire is NOT like a pressurized cylinder where the pressure in the cylinder is holding up the piston that is holding up the load. There is no piston and the air pressure immediately above the footprint is NOT holding up the tire. I go into that below. Is there proof? There is!!: Archived Copy: Fact or Fiction?Special Note: Long after I wrote the first version of this webpage, I attended a seminar where a student from Cranfield University (UK) presented a paper that addressed the issue on the relationship between the size of the contact patch and the inflation pressure and confirmed what I wrote above. Unfortunately, the paper wasn't published at the time of the presentation, but I am citing it here in the hope that it will be published in the future: Evaluation of the Contact Pressure Distribution of a Rear Combine Tyre on a Hard Surface by P. A. Misiewisc, et al, presented at the 28th Tire Society Conference in Akron, OH, USA, Sep 15 and 16, 2009. As of March, 2022, it is still unpublished. |
|
|
Revised April, 2012 In the July, 2011 issue of Road and Track, they tested 3 high performance tires. They included some details about the tires - including the areas of the footprints at the same inflation pressure and load: Revised July 2022 Unfortunately, the archived webpage I cited doesn't including the images with the footprint sizes. But luckily I saved a copy: Road and Track - July 2011 - New Summer Rubber: Page 1 Road and Track - July 2011 - New Summer Rubber: Page 2 Road and Track - July 2011 - New Summer Rubber: Page 3 So here's the math: |
|
|
Guess what? The size of the footprints are different for each tire, even though they were measured at the same load and inflation pressure - and the average footprint pressure (load divided by the footprint size) is different than the inflation pressure. |
The inflation pressure does not equal the footprint pressure. Another confirmation. |
|
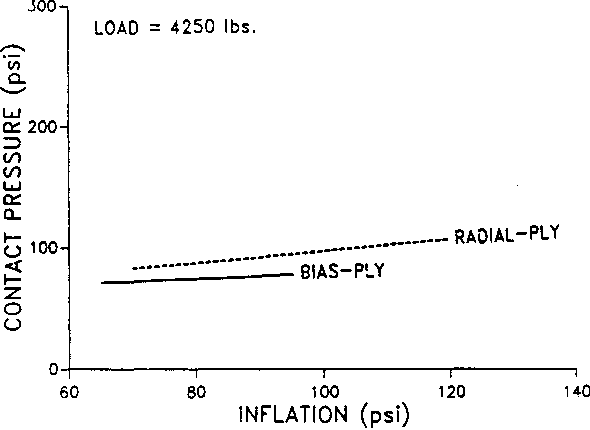
Revised March 2022: To the right is a graph from a paper that I found in the process of doing the revision.
Truck Tyres and Road Contact Pressures by P. Yap, 1989 Notice that the 2 types of tires have different lines. If the theory is correct, they should be the same. Also notice that the pressures don't line up.While the radial tire is 100 psi contact pressure at 100 psi inflation pressure, the contact pressure is 88 psi at 80 psi inflation pressure. And notice that the bias ply tire contact pressure is 75 psi at 80 psi inflation pressure, and if the line were extended to 100 psi inflation pressure, the contact pressure would be 88 psi. This is another confirmation that the theory is incorrect. |
|
|
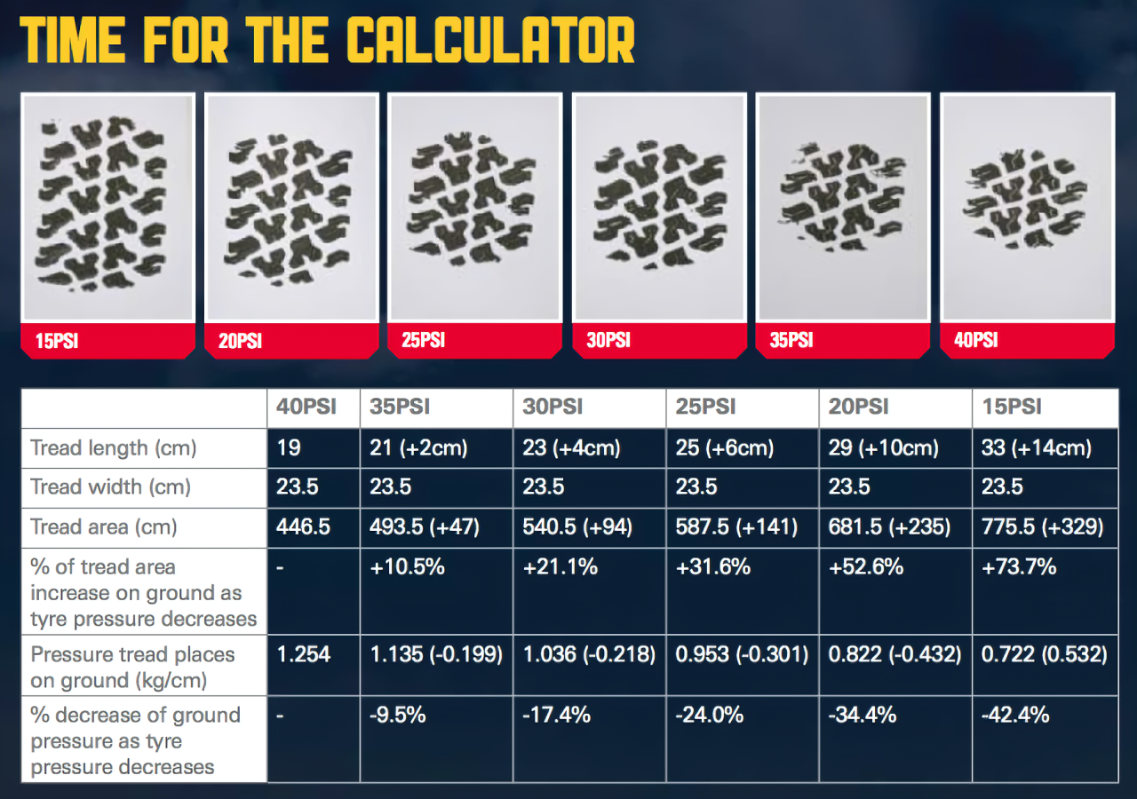
Revised July 2022: I found another one. To the left is a table from:
Archived webpage from ARB: The Low Down Off Road Tire Pressures by Mark Allen 2011 Unfortunately, he did his calculations in metric units, except for the inflation pressure. Allow me to translate that into English units: |
|
Revised Sep, 2022: And one more: Texas Transportation Institute: Measurement of Tire Footprint Pressures There are several tables where the inflation pressure is compared to the average footprint pressure. None show the inflation pressure equals the average footprint pressure. There's even a statement that says: "It is well-known, to tire engineers, that the average footprint pressure produced by a tire can be above or below the inflation pressure, depending on tire load." Page 22. I'll leave to the reader to look this paper up and read it. |
|
Revised July, 2023: And yet another one: This time it's a bit unusual. Titan Tire OTR Databook Titan International is a maker of specialty tires and wheels for such industries as mining, construction, agriculture, etc. Because of the nature of how these tires are used, it is common for tire makers of such tires to provide more data than you get with a passenger car tire. In this case the important tidbit is "Flat Plate Area". This is the size of the footprint at the rated load and rated inflation pressure on a flat plate - hence the name. Normally, these types of tires are used on unimproved surfaces, which is why they call out a flat plate so it is clear what the entry is. I hope it is obvious that not only would this be unnecessary if the theory was true, but given this information, we can calculate what the actual footprint pressure is and compare to the inflation pressure.
Let's do the first 2 just for kicks: Page 27: 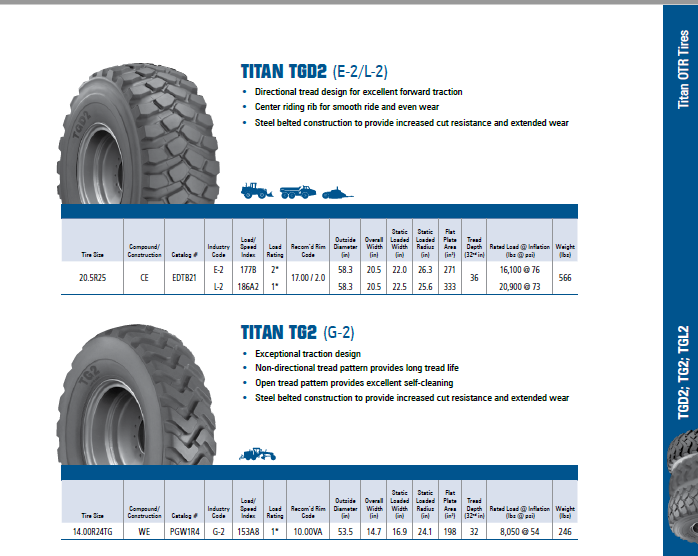
|
|
Once again, the footprint pressure is not the same as the inflation pressure. |
|
So what's going on? My theory is that the tire is being stiffened by the inflation pressure to the point where the sidewalls are supporting the weight of the vehicle. In other words, if you could make a tire's sidewall stiff enough it could support the load without inflation pressure! Guess what? That's what a RunFlat tire does! Further, it is the stiffness of the sidewall that determines the amount of deflection, and it is the deflection and the tire geometry which determines how large the footprint is. In other words, a tire designer could get a wide variety of shapes and sizes of the footprint depending on how the tread area is designed. |
|
|
If you take a look at the data above, the footprint pressure is all over the place - EXCEPT it is always lower than the inflation pressure. End of the July, 2023 revision |
|
|
|
Revised Sep, 2023 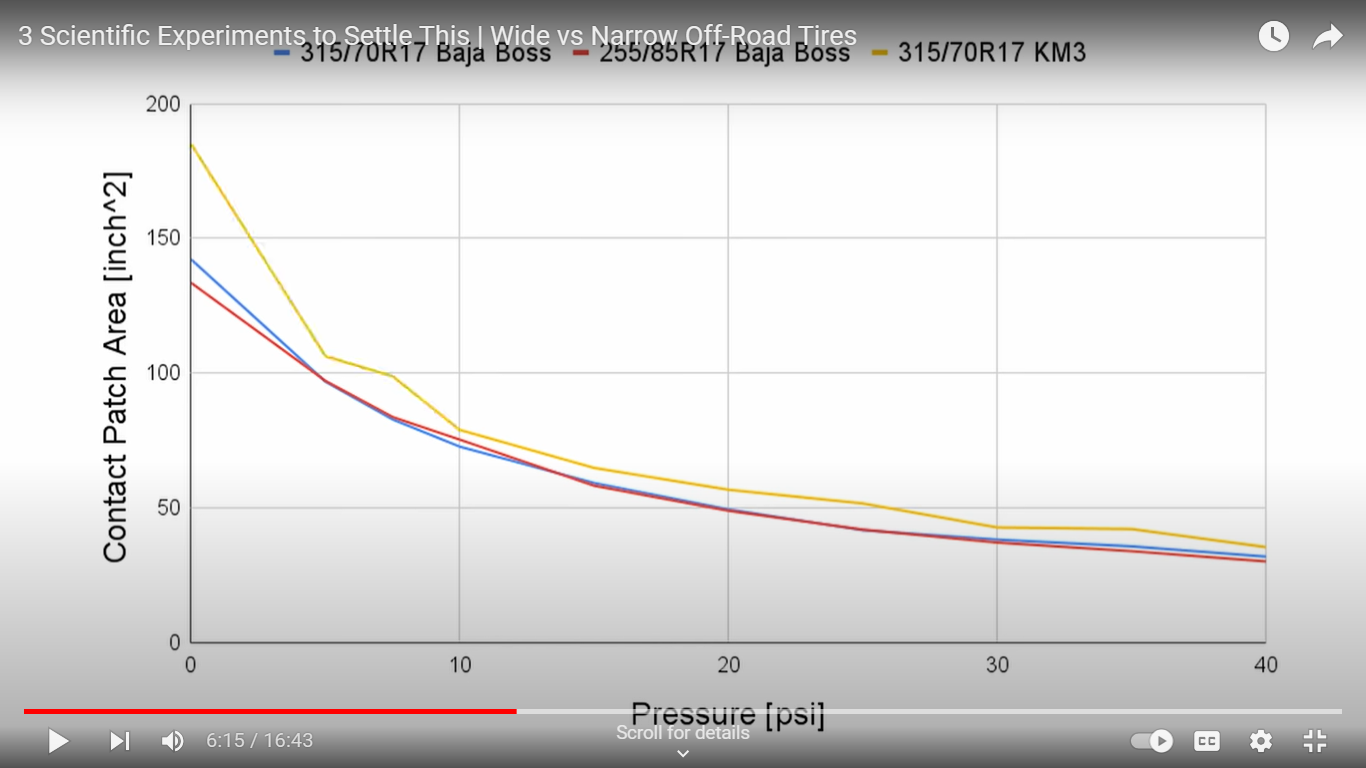
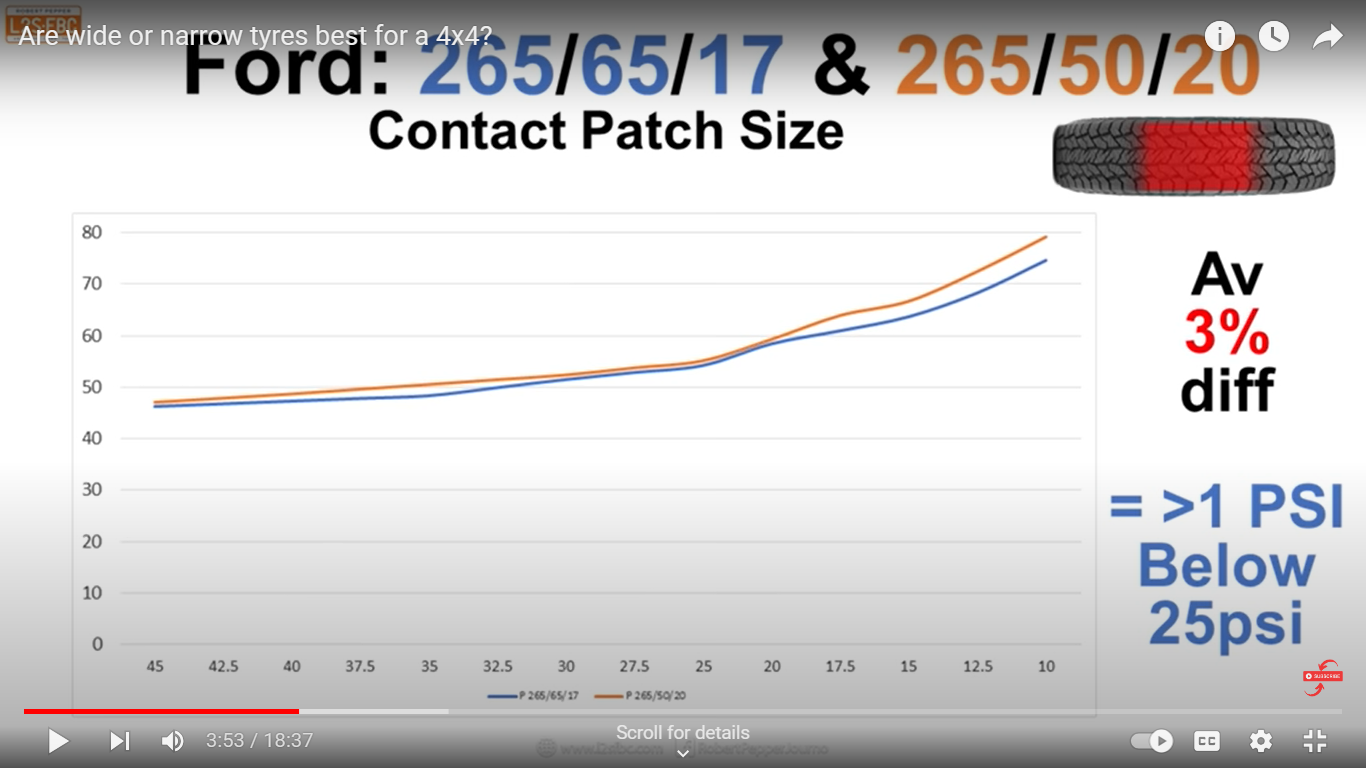
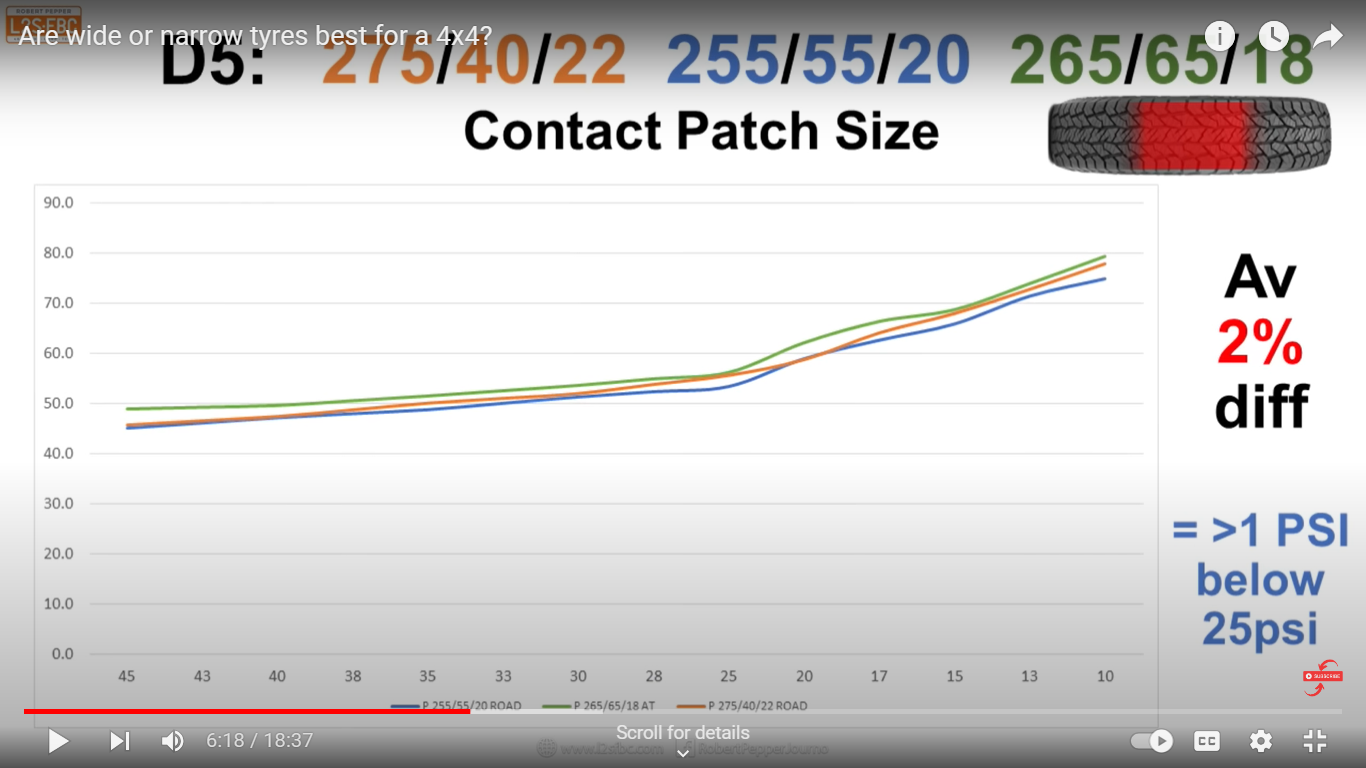
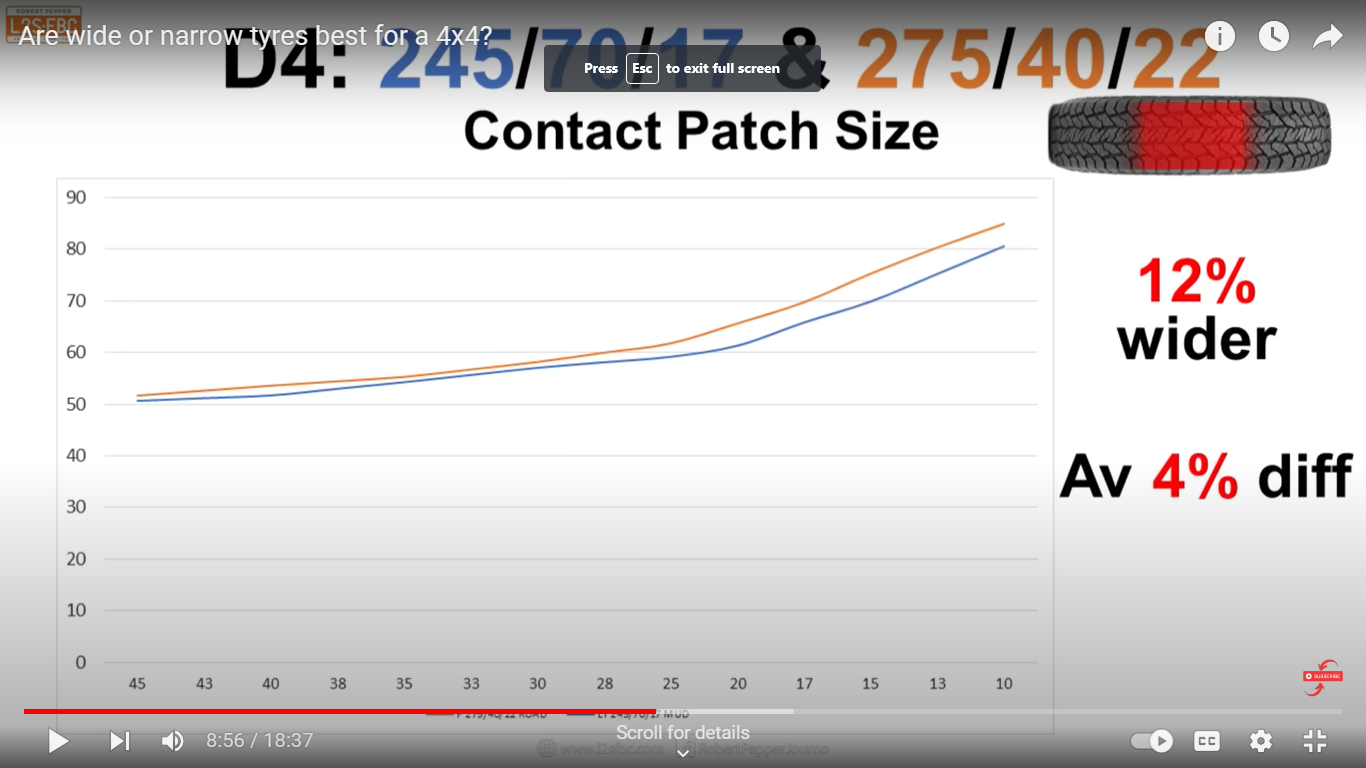
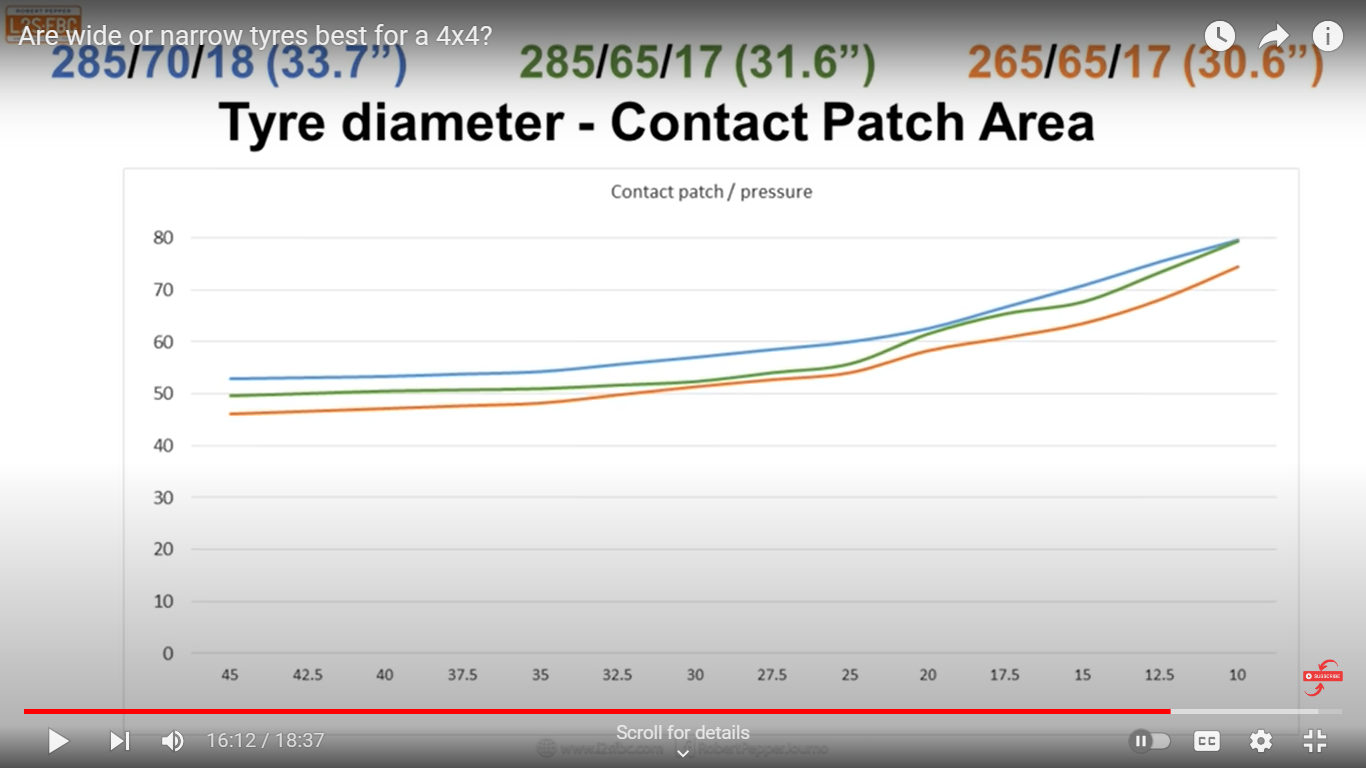
|
And even more: To the left is a series of screenshots of graphs taken from these 2 YouTube videos: Are Wide or Narrow Tyres best for a 4X4? - YouTube3 Scientific Experiments to Settle This: Wide vs Narrow Off Road Tires - YouTube Please note: The second video references the first video. Done by 2 different people and for a completely different purpose, but the jist is the same. They both measured the size of tire footprints for various tires at various inflation pressures, and even though they didn't measure the load, they have graphs that disprove the theory. To wit: The size of a tire's footprint is NOT directly proportional to the inflation pressure. Put another way: If you double the inflation pressure, you don't half the size of the footprint. To look at the graphs: Right click and click "Open Image in New Tab". Your computer will create a new tab with the graph in it. Click on that new tab to see the graph. Please note: These are screenshots. Imbedded is the time stamp of where in the video the graphs appear. Personal note: I find it very interesting that the second video got footprints that are somewhat round at low pressures - that is, not at all rectangular. Those tires were poorly designed. |
|
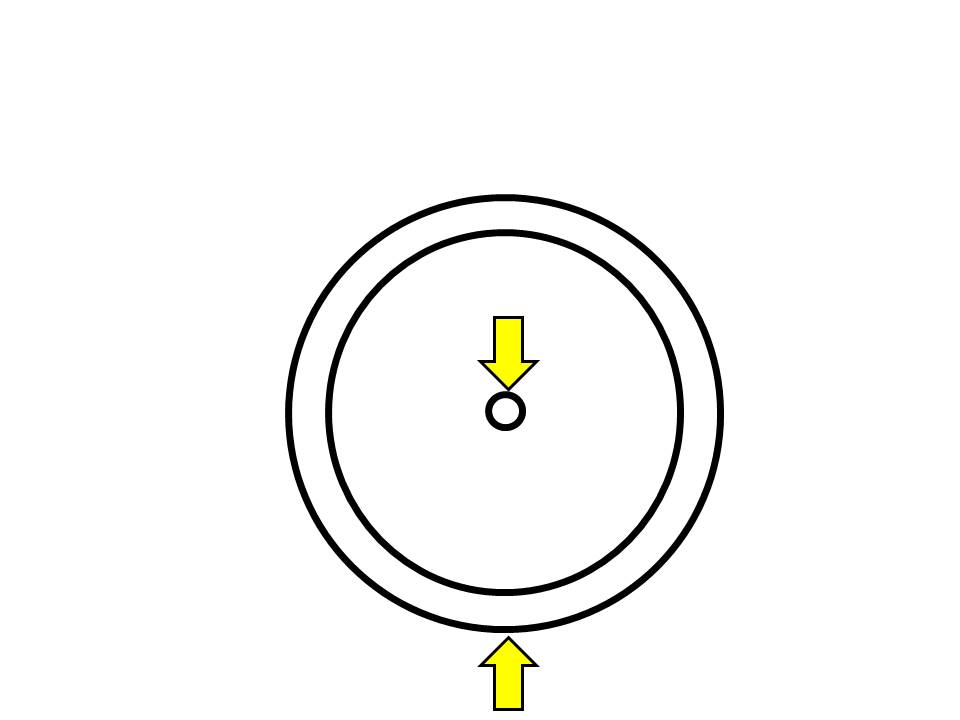
Now onto an analysis of the situation: The tire is attached to the rim and the rim is attached to the hub and it is the only thing between the tire and the vehicle. The tire is the only thing between the rim and ground (except for the air inside the tire). Looking at the rim, you can consider the rim to be a hoop of material (it's usually a metal of some sort - typically aluminum or steel) with a flange on both edges of the hoop so that the air pressure doesn't force the tire off the rim. |
|
|
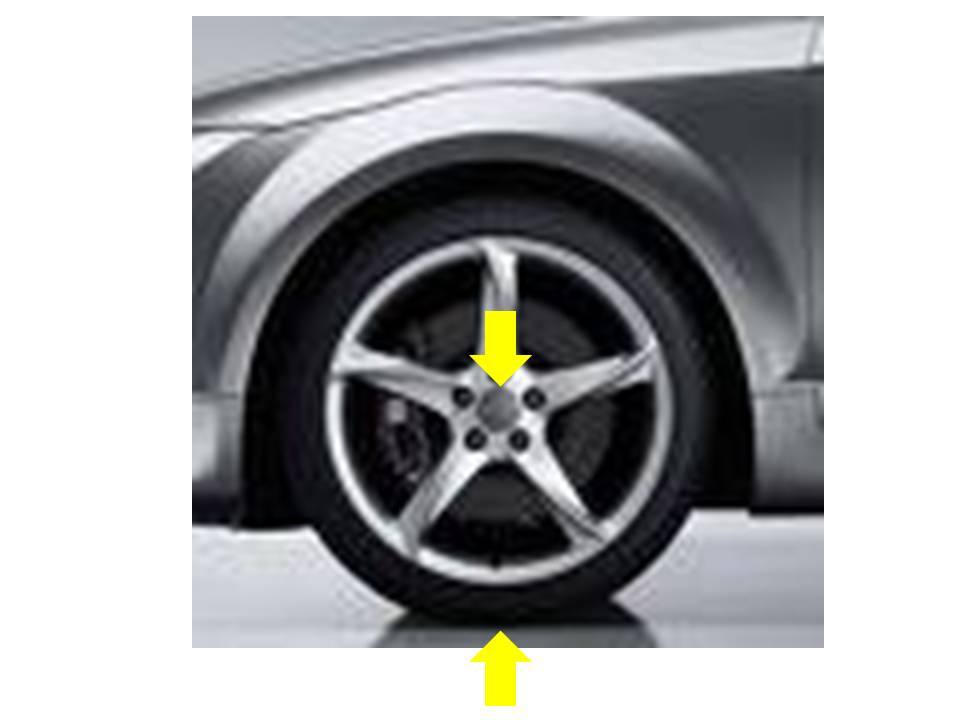
I've indicated the 2 forces that are acting on the area in question - an upward vertical force acting on the tire (the ground support) and a downward vertical force acting at the hub (the weight of the vehicle). For the purposes of this analysis, we'll neglect the weight of the rim and the tire. The weight of these components is small compared to the weight of the vehicle and doesn't affect the outcome. Now let's look at the rim (wheel) and the tire. |
| The rim is attached to the hub and it is the only thing between the tire and the vehicle. The tire is the only thing between the rim and ground (except for the air inside the tire). Looking at the rim, you can consider the rim to be a hoop of material (it's usually a metal of some sort - typically aluminum or steel) with a flange on both edges of the hoop so that the air pressure doesn't force the tire off the rim. |
|
|
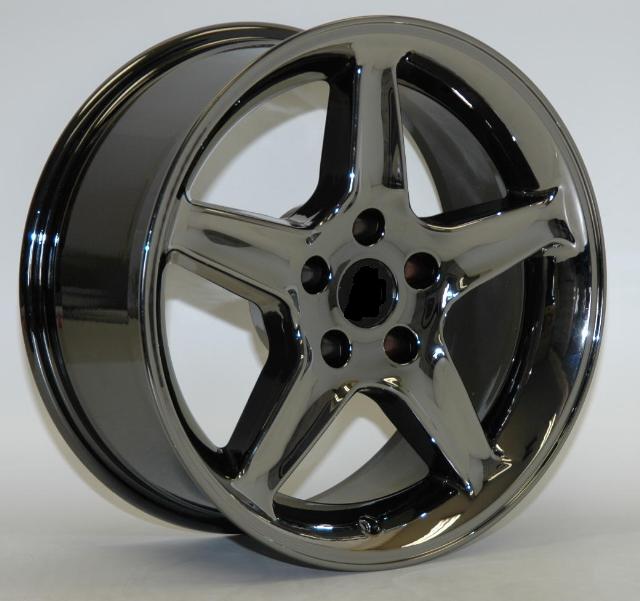
Let's ignore the tire for the moment - We'll come back to it later. The hoop shaped rim has a width, but if we look at the rim edgewise, it is a circle with a connection to the hub. This connection is sometimes called the "spider" - and the "spider" and the rim together make up the wheel. |
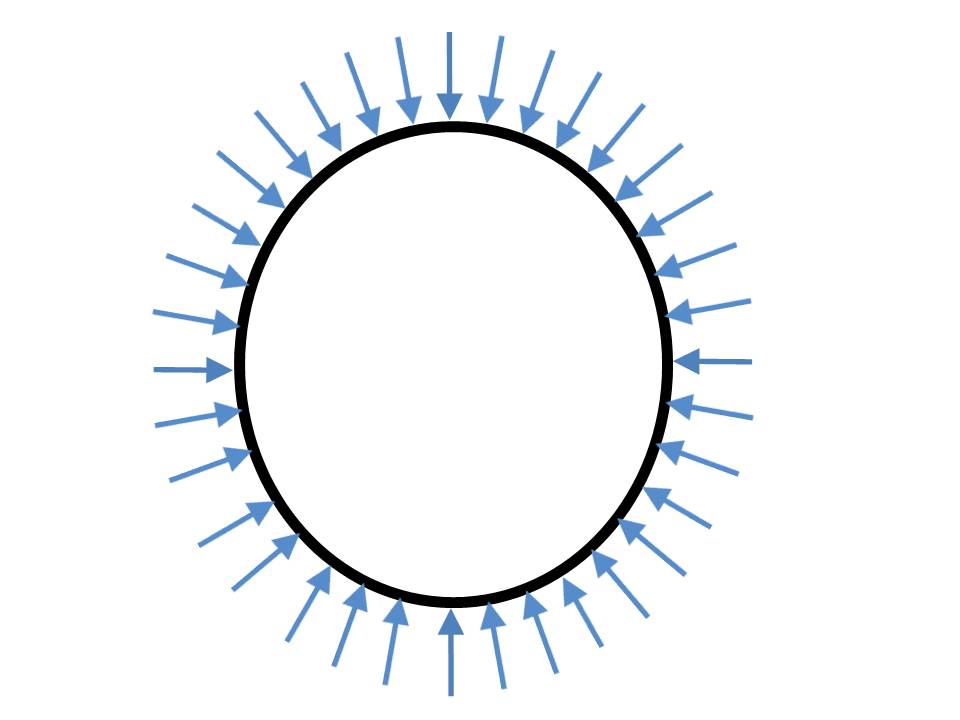
| The rim is completely surrounded by air and the air is under pressure. That pressure is pushing inwards on the rim, as illustrated to the right The pressure that is being exerted on the rim is the same completely around the rim. There is no pressure differential from left to right or from top to bottom. In other words, there is no sideways force being generated on the rim and there is no vertical force being generated on the rim (up and down). No net force at all - just a pressure towards the center. But we know the rim is carrying the load of the vehicle, so there must be something that is resisting the weight of the vehicle (and the upward force of ground) - and there is only one thing it could be. |
|
|
The tire. The tire is carrying 100% of the weight of the vehicle (and, of course, the rim). The weight of the vehicle is distributed around the structure of the tire, so that adds very little to the weight that is already being carried. If this is so, what are the implications? |
|
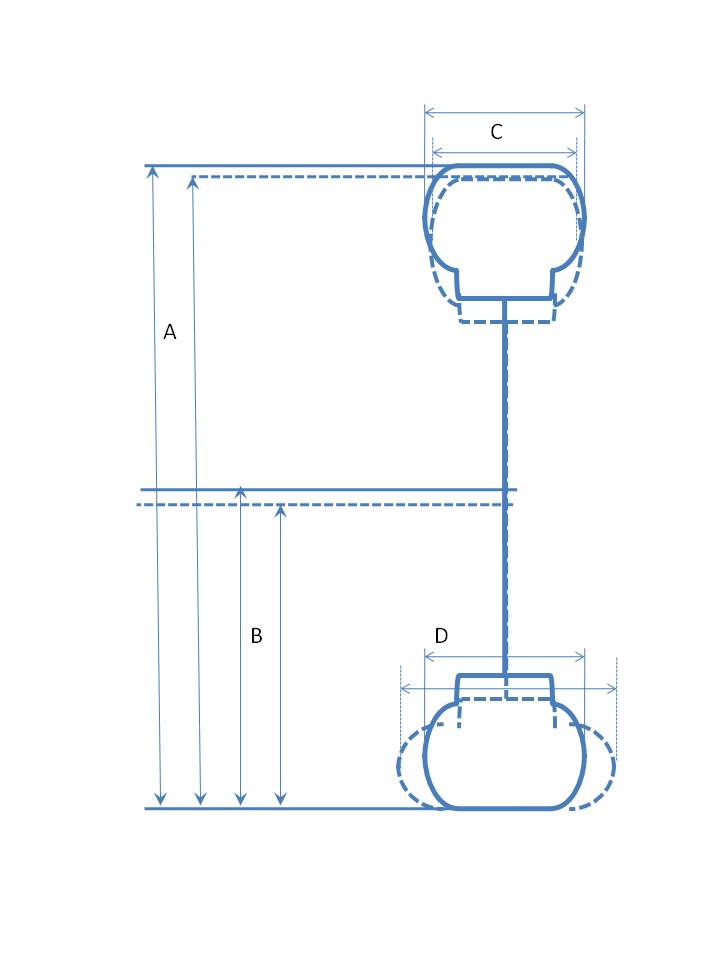
We all know that the tire deforms in the area of the footprint - you can see the sidewalls bulging out.
But if the tire is supporting 100% of the load, then the axle might also be pulling down from the top.
To the left is a schematic of this, where the solid lines are the unloaded tire and the dotted lines are the tire supporting
the load.
If the tire is doing all the support, then the entire tire is being distorted. The sidewalls near the footprint
(contact patch) bulge out because the tread is being compressed towards the rim, but also, 180° from the contact patch
(the "top" of the tire), the rim is pulling down from the tread. This should cause the section height to increase
(which is dimensions A and B), as well as the sidewalls to be sucked in a little (which is dimension C and D).
Revised March 2022: What followed this paragraph in the original page was an outline of an intended test where I predicted various measurements (including dimensions A, B, C, and D above) and follow that up with ACTUAL measurements. With the tools I had, I couldn't do that with any precision, so I abandoned the project. |
|
Barry's Tire Tech - Main Page |